Histogram density estimate
histde.RdHistogram density estimate for 1- and 2-dimensional data.
Usage
histde(x, binw, xmin, xmax, adj=0)

# S3 method for class 'histde'
predict(object, ..., x)Value
A histogram density estimate is an object of class histde which is a
list with fields:
- x
data points - same as input
- eval.points
vector or list of points at which the estimate is evaluated
- estimate
density estimate at
eval.points- binw
(vector of) bandwidths
- nbin
(vector of) number of bins
- names
variable names
Details
If binw is missing, the default binwidth is \(\hat{b}_i = 2 \cdot 3^{1/(d+2)} \pi^{d/(2d+4)} S_i
n^{-1/(d+2)}\), the
normal scale selector.
If xmin is missing then it defaults to the data minimum. If
xmax is missing then it defaults to the data maximum.
Examples
## positive data example
set.seed(8192)
x <- 2^rnorm(100)
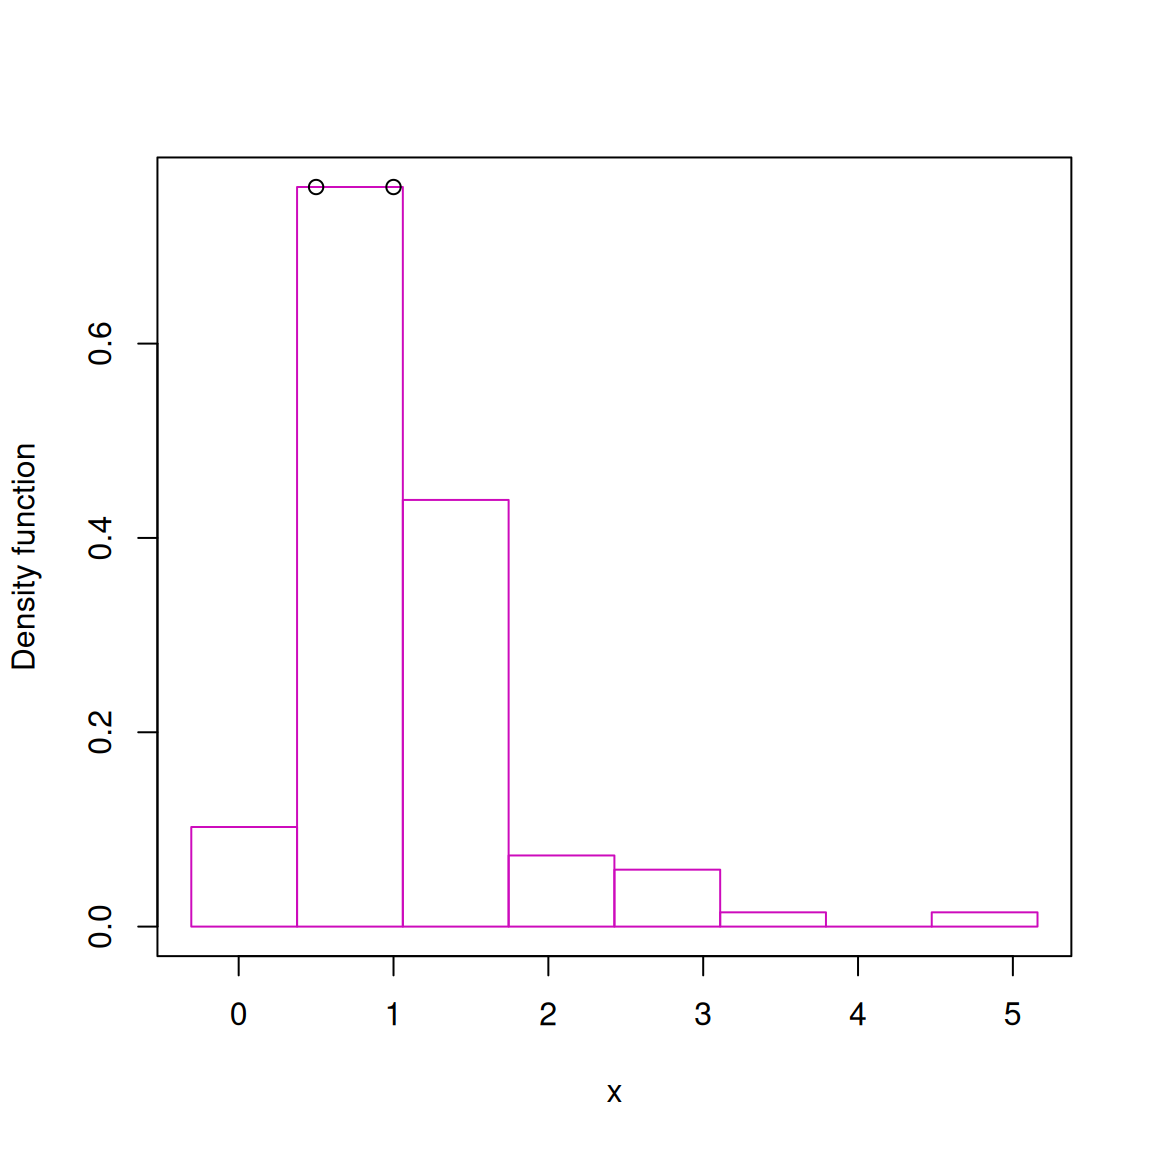
fhat <- histde(x=x)
plot(fhat, border=6)
points(c(0.5, 1), predict(fhat, x=c(0.5, 1)))
 ## large data example on a non-default grid
set.seed(8192)
x <- rmvnorm.mixt(10000, mus=c(0,0), Sigmas=invvech(c(1,0.8,1)))
fhat <- histde(x=x, xmin=c(-5,-5), xmax=c(5,5))
plot(fhat)
## large data example on a non-default grid
set.seed(8192)
x <- rmvnorm.mixt(10000, mus=c(0,0), Sigmas=invvech(c(1,0.8,1)))
fhat <- histde(x=x, xmin=c(-5,-5), xmax=c(5,5))
plot(fhat)
 ## See other examples in ? plot.histde