Kernel density ridge estimation
kdr.RdKernel density ridge estimation for 2- to 3-dimensional data.
Usage
kdr(x, y, H, p=1, max.iter=400, tol.iter, segment=TRUE, k, kmax, min.seg.size=4,
    keep.path=FALSE, gridsize, xmin, xmax, binned, bgridsize, w, fhat,
    density.cutoff, pre=TRUE, verbose=FALSE)
kdr.segment(x, k, kmax, min.seg.size, verbose=FALSE)

# S3 method for class 'kdr'
plot(x, ...)
Arguments
- x
matrix of data values or an object of class
kdr- y
matrix of initial values
- p
dimension of density ridge
- H
bandwidth matrix/scalar bandwidth. If missing,
Hpi(x,deriv,order=2)is called by default.- max.iter
maximum number of iterations. Default is 400.
- tol.iter
distance under which two successive iterations are considered convergent. Default is 0.001*min marginal IQR of
x.- segment
flag to compute segments of density ridge. Default is TRUE.
- k
number of segments to partition density ridge
- kmax
maximum number of segments to partition density ridge. Default is 30.
- min.seg.size
minimum number of points in a segment of a density ridge. Default is 4.
- keep.path
flag to store the density gradient ascent paths. Default is FALSE.
- gridsize
vector of number of grid points
- xmin,xmax
vector of minimum/maximum values for grid
- binned
flag for binned estimation.
- bgridsize
vector of binning grid sizes
- w
vector of weights. Default is a vector of all ones.
- fhat
kde of
x. If missingkde(x=x,w=w)is executed.- density.cutoff
density threshold under which the
yare excluded from the density ridge estimation. Default iscontourLevels(fhat, cont=99).- pre
flag for pre-scaling data. Default is TRUE.
- verbose
flag to print out progress information. Default is FALSE.
- ...
other graphics parameters
Value
A kernel density ridge set is an object of class kdr
which is a list with fields:
- x,y
data points - same as input
- end.points
matrix of final iterates starting from
y- H
bandwidth matrix
- names
variable names
- tol.iter,tol.clust,min.seg.size
tuning parameter values - same as input
- binned
flag for binned estimation
- names
variable names
- w
vector of weights
- path
list of density gradient ascent paths where
path[[i]]is the path ofy[i,](ifkeep.path=TRUE)
Details
Kernel density ridge estimation is based on reduced dimension kernel mean shift. See Ozertem & Erdogmus (2011).
If y is missing, then it defaults to the grid of size
gridsize spanning from xmin to xmax.
If the bandwidth H is missing, then
the default bandwidth is the plug-in selector for the density gradient
Hpi(x,deriv.order=2). Any bandwidth that is suitable for the
density Hessian is also suitable for the kernel density ridge.
kdr(segment=TRUE) or kdr.segment() carries out the segmentation of the density ridge points in end.points. If k is set, then k segments are created. If k is not set, then the optimal number of segments is chosen from 1:kmax, with kmax=30 by default. The segments are created via a hierarchical clustering with single linkage. *Experimental: following the segmentation, the points within each segment are ordered to facilitate a line plot in plot(type="l"). The optimal ordering is not always achieved in this experimental implementation, though a scatterplot plot(type="p") always suffices, regardless of this ordering.*
References
Ozertem, U. & Erdogmus, D. (2011) Locally defined principal curves and surfaces. Journal of Machine Learning Research 12, 1249–1286.
Examples
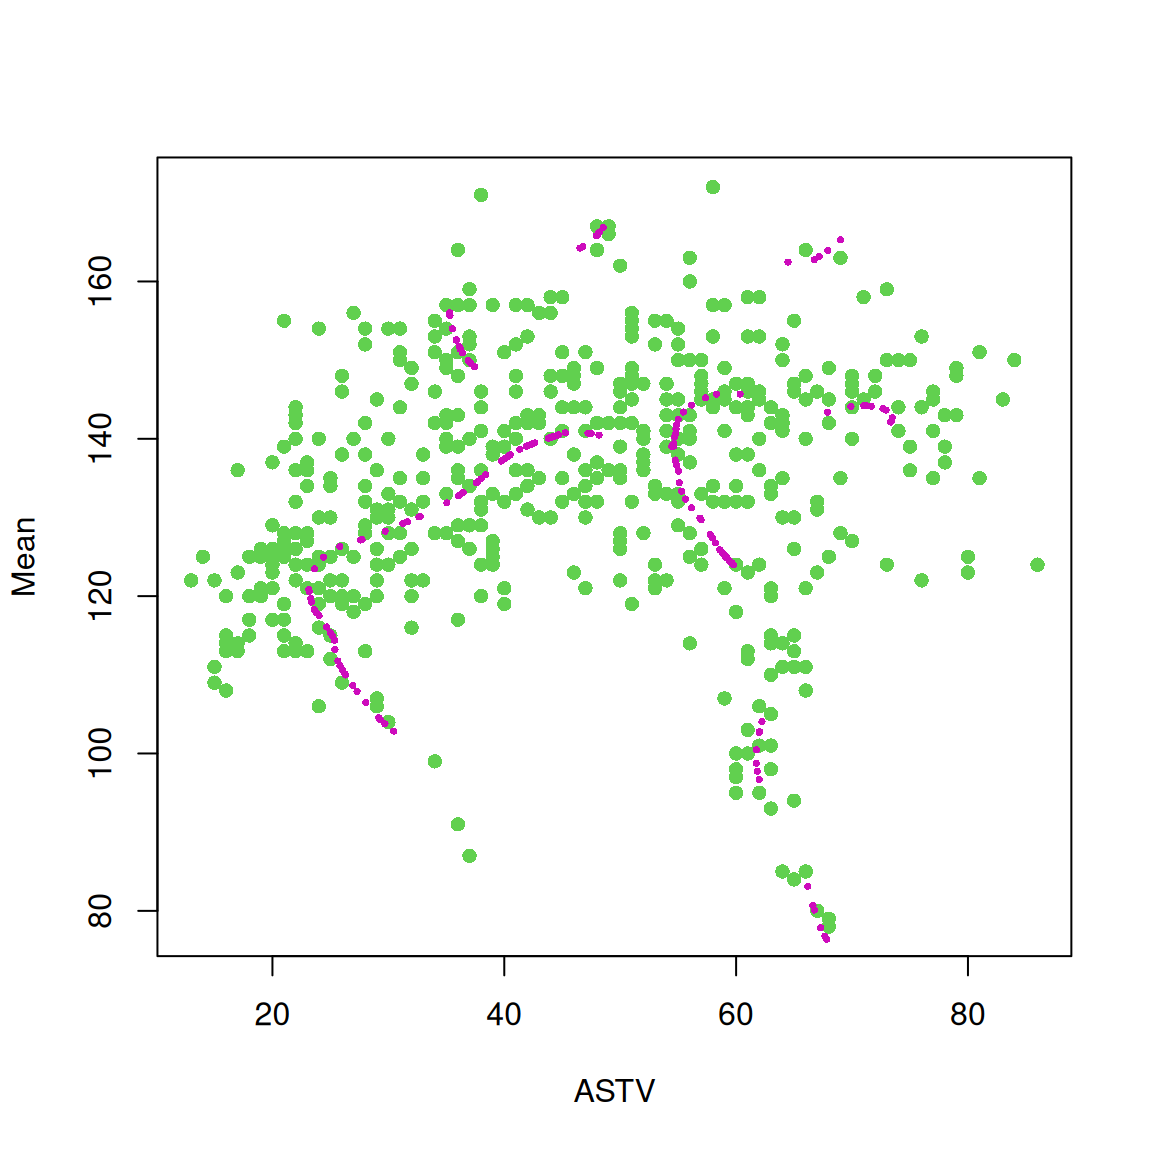
data(cardio)
set.seed(8192)
cardio.train.ind <- sample(1:nrow(cardio), round(nrow(cardio)/4,0))
cardio2 <- cardio[cardio.train.ind,c(8,18)]
cardio.dr2 <- kdr(x=cardio2, gridsize=c(21,21))
## gridsize=c(21,21) is for illustrative purposes only
plot(cardio2, pch=16, col=3)
plot(cardio.dr2, cex=0.5, pch=16, col=6, add=TRUE)


if (FALSE) { # \dontrun{
cardio3 <- cardio[cardio.train.ind,c(8,18,11)]
cardio.dr3 <- kdr(x=cardio3)
plot(cardio.dr3, pch=16, col=6, xlim=c(10,90), ylim=c(70,180), zlim=c(0,40))
plot3D::points3D(cardio3[,1], cardio3[,2], cardio3[,3], pch=16, col=3, add=TRUE)

library(maps)
data(quake)
quake <- quake[quake$prof==1,]  ## Pacific Ring of Fire
quake$long[quake$long<0] <- quake$long[quake$long<0] + 360
quake <- quake[, c("long", "lat")]
data(plate)                     ## tectonic plate boundaries
plate <- plate[plate$long < -20 | plate$long > 20,]
plate$long[plate$long<0 & !is.na(plate$long)] <- plate$long[plate$long<0 &
  !is.na(plate$long)] + 360

quake.dr <- kdr(x=quake, xmin=c(70,-70), xmax=c(310, 80))
map(wrap=c(0,360), lty=2)
lines(plate[,1:2], col=4, lwd=2)
plot(quake.dr, type="p", cex=0.5, pch=16, col=6, add=TRUE)} # }
if (FALSE) { # \dontrun{
cardio3 <- cardio[cardio.train.ind,c(8,18,11)]
cardio.dr3 <- kdr(x=cardio3)
plot(cardio.dr3, pch=16, col=6, xlim=c(10,90), ylim=c(70,180), zlim=c(0,40))
plot3D::points3D(cardio3[,1], cardio3[,2], cardio3[,3], pch=16, col=3, add=TRUE)
library(maps)
data(quake)
quake <- quake[quake$prof==1,] ## Pacific Ring of Fire
quake$long[quake$long<0] <- quake$long[quake$long<0] + 360
quake <- quake[, c("long", "lat")]
data(plate) ## tectonic plate boundaries
plate <- plate[plate$long < -20 | plate$long > 20,]
plate$long[plate$long<0 & !is.na(plate$long)] <- plate$long[plate$long<0 &
!is.na(plate$long)] + 360
quake.dr <- kdr(x=quake, xmin=c(70,-70), xmax=c(310, 80))
map(wrap=c(0,360), lty=2)
lines(plate[,1:2], col=4, lwd=2)
plot(quake.dr, type="p", cex=0.5, pch=16, col=6, add=TRUE)} # }