- In your .bashrc, add your version of two following lines
export LINBUGS_HOME="/c/tduong/home/bin/openbugs"
export LINBUGS_TEMP="/c/tduong/home/temp"
where LINBUGS_HOME is the directory where you want to install LinBugs and LINBUGS_TEMP is the directory where LinBugs writes its temporary files. -
Download LinBUGS which is contained inside the OpenBUGS.zip
file available from
http://mathstat.helsinki.fi/openbugs
Unpack this into $LINBUGS_HOME. After unpacking, check that there is a file called cbugs. If not, download it fromhttp://www.gatsby.ucl.ac.uk/~iam23/compnotes/openbugs
If there is already a file called linbugs in $LINBUGS_HOME, copy it to another file e.g. linbugs.orig. Create a file called linbugs containing the following commands#!/bin/bash export LD_ASSUME_KERNEL=2.4.1 cd $LINBUGS_HOME if [ \! -e $LINBUGS_TEMP ] ; then mkdir $LINBUGS_TEMP fi if [ -e bugs.so ] ; then ./cbugs "$LINBUGS_HOME" "$LINBUGS_TEMP" "/bugs.so" else ./cbugs "$LINBUGS_HOME" "$LINBUGS_TEMP" "/brugs.so" fi -
Check that LinBugs is executing properly by typing in the command line
whilst in the directory $LINBUGS_HOME
./linbugs
Something likeOpenBUGS ClassicBUGS release 2.1.1 type 'modelQuit()' to quit Bugs>
should appear in the command line. Quit from LinBugs by typing modelQuit(). -
The R interface functions for LinBugs are
######################################################################### ## Simple R interface for LinBugs ######################################################################### ########################################################################## ## Execute LinBugs from inside R session ## ## Parameters ## file - file of LinBUGS commands ## ## Returns ## Invisible ########################################################################## rlinbugs.exec <- function(file) { system(paste("bash $LINBUGS_HOME/linbugs <", file), ignore.stderr=TRUE) invisible() } ########################################################################## ## Reads CODA output files into R objects ## ## Parameters ## stem - stem for CODA output files ## chain.num - chain number ## ## Returns ## Matrix with 3 columns ## first column is "iter" = iteration number ## subsequent columns are the values of the each iteration of parameters ## in MCMC ######################################################################### rlinbugs.read <- function(stem, chain.num=1) { varnames <- read.table(paste(stem,"CODAindex.txt", sep="")) n.var <- nrow(varnames) n.iter <- varnames[1,3] output <- matrix(0, nrow=n.iter, ncol=(n.var+1)) for (i in 1:n.var) { if (i==1) { output.temp <- read.table(paste(stem,"CODAchain", chain.num, ".txt", sep=""), nrows=n.iter) output[,1:2] <- as.matrix(output.temp) } else if (i>1) { output.temp <- read.table(paste(stem,"CODAchain", chain.num, ".txt", sep=""), skip=(i-1)*n.iter, nrows=n.iter) output[,i+1] <- as.matrix(output.temp)[,2] } } colnames(output) <- c("iter", as.character(varnames[,1])) return(output) }Save these into rlinbugs.R in your working directory. In my case it is, /c/tduong/home/research/bugs. -
The test data set we use is the Mistibushi age-price data set. It
has two variables, price (in years) and age (in dollars).
We wish to fit a simple linear regression of the form
price = a + b*age
In your working directory, create the following files. Unfortunately I can't quite force LinBUGS to read in files from the working directory (its default is to use $LINBUGS_HOME), so you have to specify the full address of all input/ouput files.
File name Commands carsbugs.txt modelCheck("/c/tduong/home/research/bugs/carsmodel.txt") modelData("/c/tduong/home/research/bugs/carsdata.txt") modelCompile() modelInits("/c/tduong/home/research/bugs/carsinits.txt") modelUpdate(10000) summarySet("a") summarySet("b") samplesSet("a") samplesSet("b") modelUpdate(10000) summaryStats("*") samplesStats("*") samplesCoda("*","/c/tduong/home/research/bugs/output") modelQuit()carsmodel.txt model { for( i in 1 : N ) { mu[i] <- a+b*age[i] price[i] ~ dnorm(mu[i], tau) } tau ~ dgamma(0.001, 0.001) sigma <- 1 / sqrt(tau) a ~ dnorm(0, 1.0E-12) b ~ dnorm(0, 1.0E-12) }carsinits.txt list( a=0, b=0, tau=1)
carsdata.txt list(N=39, age = c(13, 14, 14,12, 9, 15, 10, 14, 9, 14, 13, 12, 9, 10, 15, 11, 15, 11, 7, 13, 13, 10, 9, 6, 11, 15, 13, 10, 9, 9, 15, 14, 14, 10, 14, 11, 13, 14, 10), price = c(2950, 2300, 3900, 2800, 5000, 2999, 3950, 2995, 4500, 2800, 1990, 3500, 5100, 3900, 2900, 4950, 2000, 3400, 8999, 4000, 2950, 3250, 3950, 4600, 4500, 1600, 3900, 4200, 6500, 3500, 2999, 2600, 3250, 2500, 2400, 3990, 4600, 450, 4700))
In the samplesCoda command in carsbugs.txt, the second argument is known as the stem, and it creates output files of the form outputCODAchainN.txt where N is the chain number, and outputCODAindex.txt, in the directory /c/tduong/home/research/bugs
Note that graphical functions are not yet (as of 31 Dec 2005) available in LinBugs.
-
Start up R in your working directory.
Some R code to implement the MCMC for the cars data is
source("rlinbugs.R") rlinbugs.exec(file="carsbugs.txt") cars <- rlinbugs.read(stem="/c/tduong/home/research/bugs/output", chain.num=1)The argument to stem in rlinbugs.read should be exactly the same as the stem in the samplesCoda.The text output in the R command line is something like
OpenBUGS ClassicBUGS release 2.1.1 type 'modelQuit()' to quit Bugs> model is syntactically correct Bugs> data loaded Bugs> model compiled Bugs> model is initialized Bugs> 10000 updates took 0 s Bugs> monitor set Bugs> monitor set Bugs> monitor set Bugs> monitor set Bugs> 10000 updates took 0 s Bugs> mean sd val2.5pc median val97.5pc sample a 8428.0 890.5 6486.0 8418.0 10220.0 10000 b -407.4 74.07 -554.9 -407.6 -243.6 10000 Bugs> mean sd MC_error val2.5pc median val97.5pc start sample a 8428.0 890.5 56.85 6753.0 8425.0 10230.0 10001 10000 b -407.4 74.07 4.753 -554.6 -406.8 -266.0 10001 10000 Bugs> CODA files written Bugs> >
The output is cars which is a matrix with 10 000 rows and 3 columns. The first column is the iteration number i.e. 10 001 to 20 000 (since the burn in period was 10 000, and the chain is run for a further 10 000 iterations). The second column is the values of the parameter a for each iteration, and the third column is the equivalent for the parameter b.You can then proceed to manipulate the cars data set e.g.
apply(cars[,-1], 2, mean)
gives the mean for a to be 8427.6630 and for b it is -407.3614 which agree with the direct output from LinBugs; andplot(cars[,c(1,3)], type="l")
which gives a plot of the trajectory of the MCMC for parameter b.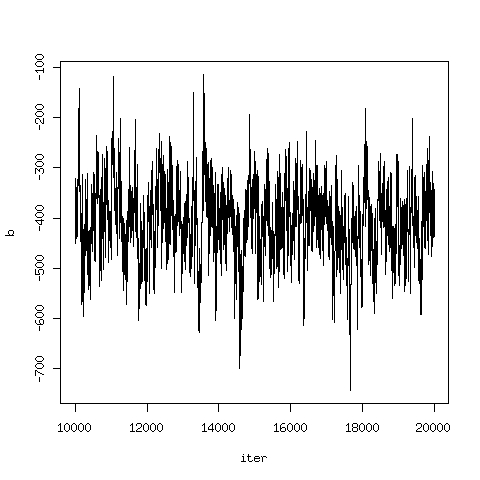
Document originally written by T. Duong in 2001, cosmetic updates June 2010.