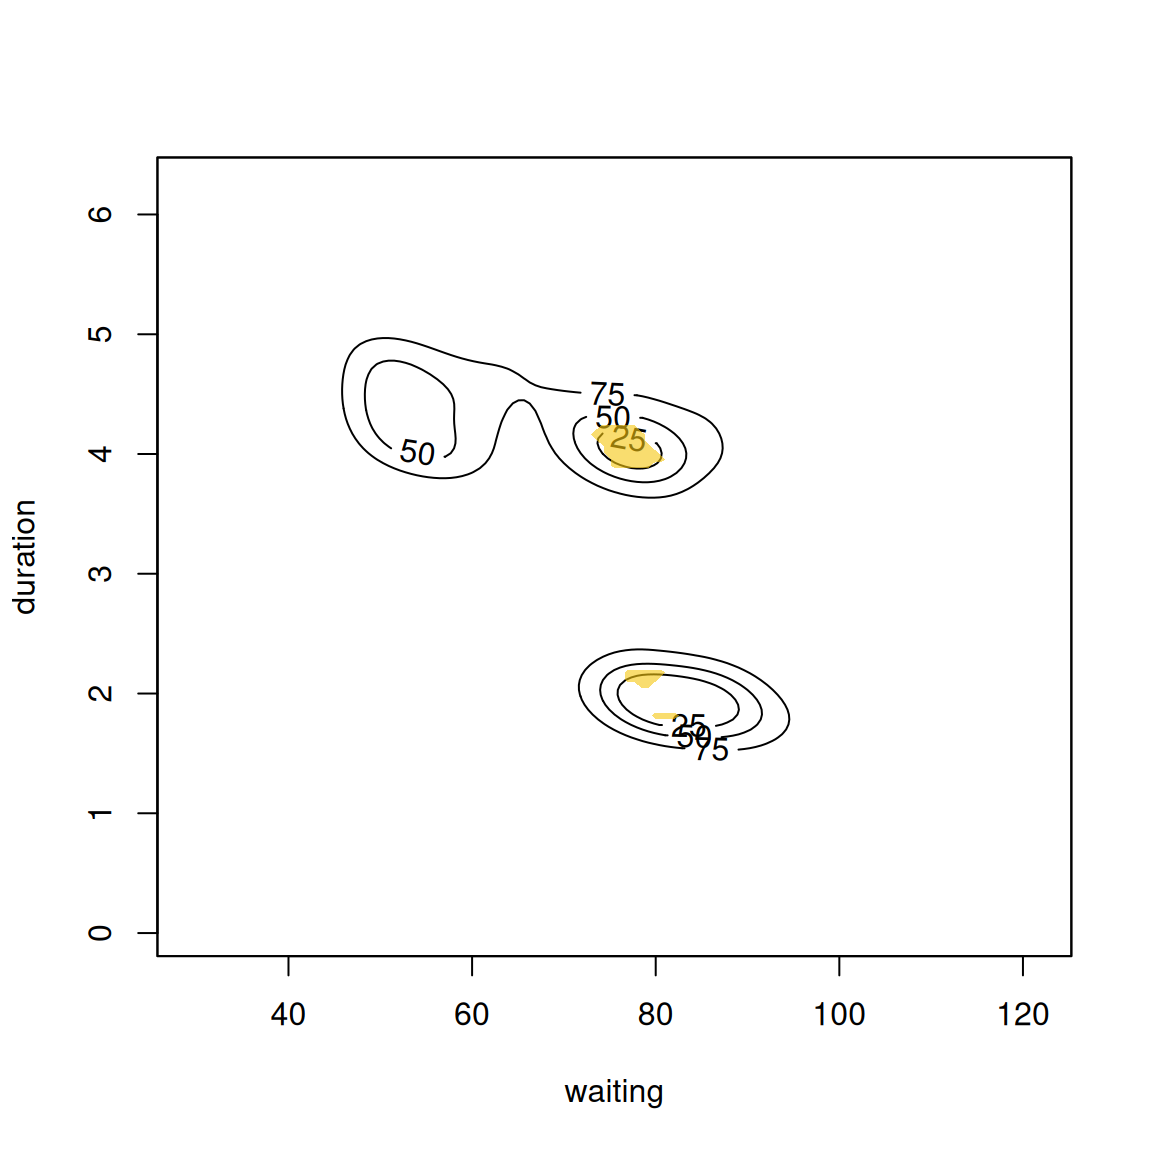
Plot for kernel feature significance
plot.kfs.RdPlot for kernel significant regions for 1- to 3-dimensional data.
Usage
# S3 method for class 'kfs'
plot(x, display="filled.contour", col=7, colors, abs.cont,
   alpha=1, alphavec=0.4, add=FALSE, ...)
Arguments
- x
object of class
kfs(output fromkfs)- display
type of display, "slice" for contour plot, "persp" for perspective plot, "image" for image plot, "filled.contour" for filled contour plot (2-d); "plot3D", "rgl" (3-d)
- col,colors
colour for contour region
- abs.cont
absolute contour height. Default is 0.5.
- alpha
transparency value for contour (2-d)
- alphavec
vector of transparency values for contour (3-d)
- add
flag to add to current plot. Default is FALSE.
- ...
other graphics parameters used in
plot.kde
Value
Plots for 1-d and 2-d are sent to graphics window. Plot for 3-d is sent to graphics/RGL window.